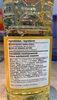
Matières grasses végétales
Fait partie de :
Matières grasses, Aliments d'origine végétale, Aliments et boissons à base de végétaux
Contient :
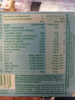
Tableau nutritionnel
Composition nutritionnelle moyenne pour les 661 produits de la catégorie Matières grasses végétales dont les informations nutritionnelles sont connues (sur un total de 713 produits).
| Tableau nutritionnel | Tel que vendu pour 100 g / 100 ml |
Ecart type | Minimum | 10ème centile | Médiane | 90ème centile | Maximum |
|---|---|---|---|---|---|---|---|
| Énergie |
3 300 kj (793 kcal) |
623 kj (148 kcal) |
0 kj (0 kcal) |
1 660 kj (398 kcal) |
3 450 kj (828 kcal) |
3 770 kj (900 kcal) |
3 790 kj (915 kcal) |
| Matières grasses | 87,6 g | 17,3 g | 1 g | 40 g | 92 g | 100 g | 100 g |
| Acides gras saturés | 16,6 g | 14,2 g | 0 g | 7,7 g | 14 g | 34 g | 100 g |
| Acides gras monoinsaturés | 48,7 g | 24,7 g | 0 g | 10 g | 64 g | 77 g | 80 g |
| Acides gras polyinsaturés | 17,1 g | 13,4 g | 0 g | 6 g | 12 g | 55 g | 71 g |
| Acides gras Oméga 3 | 3 770 mg | 2 000 mg | 3,5 mg | 1 500 mg | 3 700 mg | 8 100 mg | 9 500 mg |
| Acides gras Oméga 6 | 15 000 mg | 11 400 mg | 12 mg | 14 mg | 15 000 mg | 41 000 mg | 42 000 mg |
| Glucides | 0,098 g | 0,231 g | 0 g | 0 g | 0 g | 0,5 g | 65 g |
| Sucres | 0,059 g | 0,157 g | 0 g | 0 g | 0 g | 0,5 g | 58 g |
| Fibres alimentaires | 0,052 g | 0,15 g | 0 g | 0 g | 0 g | 0,5 g | 32 g |
| Protéines | 0,069 g | 0,169 g | 0 g | 0 g | 0 g | 0,5 g | 33 g |
| Sel | 0,044 g | 0,117 g | 0 g | 0 g | 0 g | 0,31 g | 25 g |
| Alcool | 0 % vol | 0 % vol | 0 % vol | 0 % vol | 0 % vol | 0 % vol | 0 % vol |
| Vitamine A (rétinol) | 793 µg | 33,4 µg | 120 µg | 710 µg | 800 µg | 801 µg | 917 µg |
| Vitamine D | 7,37 µg | 0,343 µg | 6 µg | 6,6 µg | 7,5 µg | 7,5 µg | 7 500 µg |
| Vitamine E (tocophérol) | 23,4 mg | 19,3 mg | 0 mg | 7,5 mg | 18 mg | 60 mg | 33 900 mg |
| Vitamine B1 (Thiamine) | 1,07 mg | 0,43 mg | 0,27 mg | 0,27 mg | 1,1 mg | 1,8 mg | 550 mg |
| Vitamine B2 (Riboflavine) | 1,48 mg | 0,22 mg | 1,4 mg | 1,4 mg | 1,4 mg | 2,3 mg | 2,3 mg |
| Vitamine B12 (cobalamine) | 2,82 µg | 0,614 µg | 2,5 µg | 2,5 µg | 2,5 µg | 3 800 µg | 3 800 µg |
Pays : Belgique - Voir les produits correspondants du monde entier
712 produits
-
Primevère Tartine & Cuisson - 250 g

-
Huile d'olive vierge extra - Primadona - 1 L

-
matière grasse - St Hubert - 510 g

-
Primadonna huile d'olive vierge extra - 750ml

-
Huile de tournesol - VitaDor - 1l

-
Vita Coco - VITAQUELL - 250 g
-
Coconut oil - Bumble bee foods - 500ml
-
ProActiv - Becel
-
Natives Olivenöl extra - Primadonna - 750ml
-
omega 3 original - Becel - 225 g
-
Huile de colza - Bouton d'or - 1 l
-
Huile de coco vierge - Carrefour Bio - 460 ml
-
ST HUBERT OMEGA 3 doux 255G FRNL - 255 g
-
Huile de coco - VITALD’OR - 500ml
-
Chili & Garlic flavoured oil - 500 ml
-
Omega 3 - spring - 250g
-
Huile d’olive - Pietro Coricelli - 1l

-
Alpro 100% végétal - Alpro soya - 250 gr
-
Light margarine omega 3 - Becel - 225 g

-
HUILE 50+ - QUINTESENS - 0,5 L
-
Huile d'olive - Carrefour - 75 cl

-
Becel omega 3 original

-
Huile pour friture - Everyday
-
Halvarine - Blue Band - 500g

-
Planta - 450 g

-
Pflanzencreme - Vita Dor (Lidl) - 500ml
-
VITELMA Essential Light - 250g
-
smeren zonder palmolie light - the flower farm - 375 g
-
Spéciale pizza pimentée - Carrefour - 25 cl

-
Becel - 500ml

-
Brat Olivenöl - Primadonna - 500ml

-
Huile d olive bio - Boni
-
Huile de Colza - SimplCarrefour - 1 l
-
Olio extra vergine di oliva CLASSICO - Sagra - 1000 mL
-
Viospread unsalted - Violife - 250g

-
Planta classic - 500g
-
Margarine - Flower farm - 225 g

-
Huile vierges colza - Vigean - 50 cl
-
Alpro Soja Cuire Et Rotir - 445g
-
Huile d'arachide - Lesieur - 1 L e
-
Huile de coco - Bio Wise - 400g
-
Huile d'olive vierge extra - Boni

-
Classic à tartiner - Lidl - 500 g

-
Huile de coco - VitaD'or - 460 g, 500 ml
-
Słynne MR - 500 g
-
Benecol light
-
Alors cuire & rôtir - Alpro - 500 gr

-
Olio extra vergine di oliva - Bertolli
-
HUILE D'OLIVE VIERGE EXTRA ESPAGNOLE - Primadonna - 500ml
-
Huile de Sésame première pression à froid - Émile Noël
-
Baking Spray - Belbake - 200 ml
-
Vegan block - naturali - 200 g

-
Huile d'olive bio

-
Bios huile d'olive vierge extra biolofique - Monini - 500 ml
-
light - Becel - 250 g
-
Huile de colza bio - Boni
-
Becel - 3 x 10 g
-
Kokos Öl - Borchers - 200ml
-
Margarine - Solo - 250g
-
Halvarine - Albert Heijn - 500 g

-
Stylesse tartinable - Carrefour - 250 g
-
Il Frantolio Olio Extra Vergine - Carapelli - 1l
-
Margarine

-
Bratella Culinair - 500 ml

-
Buttella Light plus - Butella - 250 g e

-
Tera creta estate - Terra Creta - 1 l

-
Cuisine - Carrefour - 445 g 500 ml

-
Oméga 3 extra - Matières grasses à tartiner 38 % - Delhaize - 1
-
Huile de Colza (Raps) - Vandemoortele - 1pcs

-
Huile d'olive vierge extra - Everyday

-
Halvarine - Albert Heijn

-
Light boter - Boni
-
Effi - 500 g

-
Alpro Tartinable Fibres

-
Light - Margarine à tartiner à l'huile de tournesol - VITAD'OR - 250 gr
-
Bio Olio extra vergine Di olivia - Carapelli - 750 ml

-
Huile de tournesol - orabella - 1l
-
Huile d’olive vierge extra - Boni Selection - 75 cl
-
Eat plants free of palm - 225g

-
Huile d'olive vierge extra biologique - Pietro Coricelli - 750 ml

-
Huile d'olive vierge extra - Borges - 2 L

-
Pate à tartiner Noisettes avec Morceaux - Torku - 370 g
-
Coconut oil odourless
-
Margarine - Becel - 250 g
-
Alpro Light

-
Huile d’olive - Élibio - 1l

-
Huile d'olive vierge extra Espagnole - El cultivador - 750 ml

-
Tartiner Cuire et Rôtir - Buttella - 1 kg
-
Huile coco biologique - Orabella - 460g
-
Tartinable - Carrefour - 250 g
-
Margarine Light 25% mg. 250 gr. - Delhaize - 250 g

-
Soya - Alpro - 250 g
-
Olio extra vergine Di olivia - Bertolli - 500 ml
-
Huile d'olive extra vierge - oliveraies Stefanini - 750 ml
-
Huile de sésame Ayam™ - 210 ml
-
Huile pour Friture

-
Huile de colza - Colruyt
-
GERAFFINEERDE ZONNEBLOEMOLIE -
-
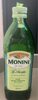
Olio extra vergine di oliva - Monini
-
Smeerboter - Rama - 500g
