Matières grasses - Page 5
Contient :
- Matière grasse mélangée végétale et laitière à tartiner à 30-40% MG
- Matière grasse mélangée végétale et laitière à tartiner à 30-40% MG demi-sel
- Matière grasse mélangée végétale et laitière à 50-63% MG
- Matière grasse mélangée végétale et laitière à 50-63% MG demi-sel
- Matières grasses animales
- Huiles et graisses autrichiennes
- Huiles et graisses britanniques
- Huile de beurre
- Huiles et graisses croates
- Matière grasse laitière à 20% MG légère à tartiner doux
- Matière grasse laitière à 25% MG légère à tartiner doux
- Huiles et graisses grecques
- Huiles et graisses italiennes
- Huile de paraffine
- Matières grasses végétales
- Huile de noix de cèdre
Tableau nutritionnel
Composition nutritionnelle moyenne pour les 872 produits de la catégorie Matières grasses dont les informations nutritionnelles sont connues (sur un total de 938 produits).
| Tableau nutritionnel | Tel que vendu pour 100 g / 100 ml |
Ecart type | Minimum | 10ème centile | Médiane | 90ème centile | Maximum |
|---|---|---|---|---|---|---|---|
| Énergie |
3 160 kj (761 kcal) |
663 kj (158 kcal) |
0 kj (0 kcal) |
1 510 kj (362 kcal) |
3 440 kj (824 kcal) |
3 770 kj (900 kcal) |
3 790 kj (915 kcal) |
| Matières grasses | 83,8 g | 18,3 g | 1 g | 40 g | 91,6 g | 100 g | 100 g |
| Acides gras saturés | 21,7 g | 16,8 g | 0 g | 8 g | 14 g | 57 g | 100 g |
| Acides gras monoinsaturés | 47 g | 24,6 g | 0 g | 11 g | 62 g | 75 g | 80 g |
| Acides gras polyinsaturés | 16,2 g | 12,2 g | 0 g | 6 g | 12 g | 48 g | 71 g |
| Acides gras Oméga 3 | 3 660 mg | 2 090 mg | 3,5 mg | 154 mg | 3 600 mg | 8 100 mg | 9 500 mg |
| Acides gras Oméga 6 | 14 700 mg | 9 580 mg | 12 mg | 29,4 mg | 15 000 mg | 37 000 mg | 42 000 mg |
| Glucides | 0,293 g | 0,551 g | 0 g | 0 g | 0 g | 1,5 g | 65 g |
| Sucres | 0,168 g | 0,273 g | 0 g | 0 g | 0 g | 0,6 g | 58 g |
| Fibres alimentaires | 0,063 g | 0,161 g | 0 g | 0 g | 0 g | 0,5 g | 32 g |
| Protéines | 0,191 g | 0,301 g | 0 g | 0 g | 0 g | 0,8 g | 33 g |
| Sel | 0,173 g | 0,379 g | 0 g | 0 g | 0 g | 1,2 g | 25 g |
| Alcool | 0 % vol | 0 % vol | 0 % vol | 0 % vol | 0 % vol | 0 % vol | 0 % vol |
| Vitamine A (rétinol) | 756 µg | 105 µg | 0 µg | 602 µg | 800 µg | 801 µg | 2 000 µg |
| Vitamine D | 7,47 µg | 2,11 µg | 0 µg | 6 µg | 7,5 µg | 7,5 µg | 7 500 µg |
| Vitamine E (tocophérol) | 22,3 mg | 18,4 mg | 0 mg | 6,1 mg | 17 mg | 67 mg | 33 900 mg |
| Vitamine B1 (Thiamine) | 0,959 mg | 0,482 mg | 0,26 mg | 0,27 mg | 1,1 mg | 1,8 mg | 550 mg |
| Vitamine B2 (Riboflavine) | 1,48 mg | 0,22 mg | 1,4 mg | 1,4 mg | 1,4 mg | 2,3 mg | 2,3 mg |
| Vitamine B6 (Pyridoxine) | 1,54 mg | 0,271 mg | 1,4 mg | 1,4 mg | 1,4 mg | 2,3 mg | 2,3 mg |
| Vitamine B12 (cobalamine) | 2,84 µg | 0,585 µg | 2,5 µg | 2,5 µg | 2,5 µg | 4,2 µg | 3 800 µg |
Pays : Belgique - Voir les produits correspondants du monde entier
935 produits
-
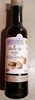
Beurre du pays
-
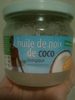
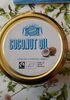
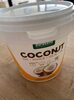
Coconut oil - Terra Sana
-
Margarine met verminderd vetgehalte - Becel

-
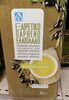
Omega 3 - Boni - 500 g
-
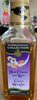
Beurre D'isigny Doux Rouleau Aoc - Isigny Sainte-Mère - 250.0 g

-
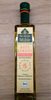
Huile d'olive vierge extra 98% aromatisée au basilic de la Drôme - A L'Olivier - 25cl

-
Soja cuire et rôtir - Carrefour - 500g
-
Beurre d'arachide - Delhaize - 350g
-
Margarine - Boni
-
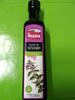
Huile de sésame - Boni
-
Huile de coco extra virgin - Marma - 300 ml
-
Beurre sans lactose - Dilea

-
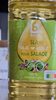
Beurre Salé - Etienne Bodart - 250 g

-
Margarine allégée 100% végétale - Olma - 500 g

-
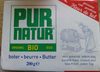
Beurre salé - Pur Natur - 200 g
-
Huiles de coco

-
Extra virgin olive oil - La Española - 1000 ml
-
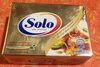
Margarine - Solo
-
Bertoli - 225 gr
-
Margarine - Becel - 250g
-
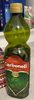
Huile d'olive extra vierge de koroni - Origine : Grèce - 1L

-
Spray huile d'olive vierge extra - Terra Creta
-
Isio 4 - Lesieur - 2 l
-
Huile d'olive vierge extra - Puget - 75 cl

-
Matiere grasse pour cuire et rotir. - Everyday - 500 g
-
Aceite de sesamo botella 200 ml - Tiger Khan
-
Huile d'olive a l'ail - Delhaize - 200 ml

-
Olijfolie extra zuiver - AB - 3 l
-
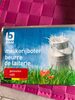
Beurre de laiterie - boni - 250 g
-
Huile de colza (arome beurre) - Die kleine Mühle - 500 ml
-
Beurre doux

-
Planta Margarine - 250g
-
Huile d olives extra vierge -

-
Huile de noisette - Carrefour - 25 cl
-
Huile d'olive truffe blanche - Boni
-
Huile d'olive aux piments - Boni
-
Huile de tournesol - 365 - 50.0 cl

-
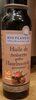
Huile de noix - Bio Planète - 25 cl
-
Aceite de sésamo - la masia
-
Coconut oil
-
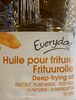
Huile pour friture - Everyday
-
Smeerbaar met olijfolie - Albert Heijn

-
Olive oil - Pietro Coricelli
-
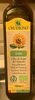
Huile d'olive vierge extra bio - Soléou
-
Huile pour friture sans odeur - Boni

-
Huile d'olive - olisone
-
Margarine - Planta - 250 g

-
Huile d'olive vierge extra -
-
Tournesol, huile vierge biologique - Emile noel
-
Becel bio
-
Olio di cocco liquido - Fratelli Mantova - 200 ml
-
Huile d'olive extra vierge - Delhaize

-
Huile pour friture - oilio
-
Sesame oil - Blue Dragon - 150 ml

-
Oivariini vähärasvaisempi - Valio - 350g

-
Chinese wok olie - international collection - 250 ml
-
Huile d'olive extra vierge - Delhaize

-
Olio di semi di girasole - Crudigno - 750 g
-
Huile de noix de coco

-
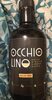
Occhiolino (huile d'olive vierge extra)
-
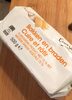
Kruiden-boter - Beurten aux fines herbes - Boni
-
Huile de coco - Purasana
-
Huile de lin

-
Aceite de oliva virgen extra

-
Huile pour salade 100 % colza - Boni
-
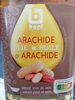
Huile d'arachide - Boni
-
Huile d’olive vierge extra - Carbonell
-
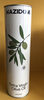
Huile d'Olive Extra Vierge Bio - Kazidomi - 1 l
-
Huile de foie de morue - Diego natura
-
Olijfolie met chilipeper - Boni
-
ActivPlus - VitaD'or - 250 g

-
Bio kokosolie

-
Huile de noix - Colruyt
-
Huile d’olive - Delhaize - 1000 ml
-
Huile d'olive à l'arôme de truffe blanche - Boni Selection

-
Huile de noisette grillées - Bio Planete
-
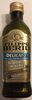
ExtraVirgin Olive oil - Filippo Berio - 500 ml
-
Huile d'olive - El Cultivador - 3 l

-
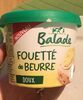
Fouetté de beurre - Balade
-
Planten Margarine - Albert Heijn

-
Organic Greek Extra Virgin Olive oil - Minerva - 750 ml

-
Huile de tournesol - Colruyt
-
Organic Coconut Oil

-
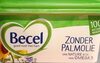
Becel zonder palmolie - 450 g
-
Huile d‘olive extra vierge - Delhaize

-
Huile d'olive italienne extra vierge
-
Beurre pasteurisé - . - 250 g

-
Olio extra vergine di oliva -
-
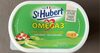
St hubert omega3
-
Huile de tournesol - VITAD'OR - 5 L

-
Sésame oil
-
Roomboter ongezouten - Albert Heijn

-
Huile de tournesol vierge BIO - carrefour - 50 cl

-
Pat beurre doux alu 250g - Paturages - 250 g
-
Reese's Spreads Peanut Butter Chocolate - 368 g
-
Beurre demi sel - Président - 250 grammes

-
Huile d'arachide (Erdnussöl) - Vitasia - 250 ml
-
Boursin® Cuisine 3 Poivres - 240 g
-
Boursin® Cuisine Echalote & Ciboulette - 240 g
-
Beurre demi-sel gros grains - Isigny Ste Mère - 250 g